AUTHOR // Sarah Mowery
Advocating for your library has never been more important. Through numbers you can share the value of your library, sending a powerful message to your audience. However, just sharing the numbers without context can be confusing. As Len Bryan (2020) states in Data Informed Library Advocacy from #AASL19, "library numbers and statistics are pretty meaningless to anyone else unless they are connected to your school and/or district priorities."

Start your data journey by beginning with your school district's goals, beliefs, or commitments. Does your school district have a Continuous Improvement Plan? How does your library support the goals to increase student outcomes?
Look at these areas of your library to determine how they align with district's goals:
In the eBook, Say It With Data: A Concise Guide to Making Your Case and Getting Results, Dando (2014) states that "positive, proactive communication through evidence-based advocacy is a necessity for successful library programs."
Types of Data and Where to Find It
Sharing your library's story through numbers is important. Counting and keeping track of the day-to-day operations in your library is a great place to start. If you don't already, begin keeping track of the number of technology items that you manage, the number of students who use the library space, and how many times you helped a student find that just right book. This can be done with a notebook that you keep at the circulation desk, or you can make a digital form, such as Google Forms to keep track of library activities and usage.
Circulation and Catalog Reports
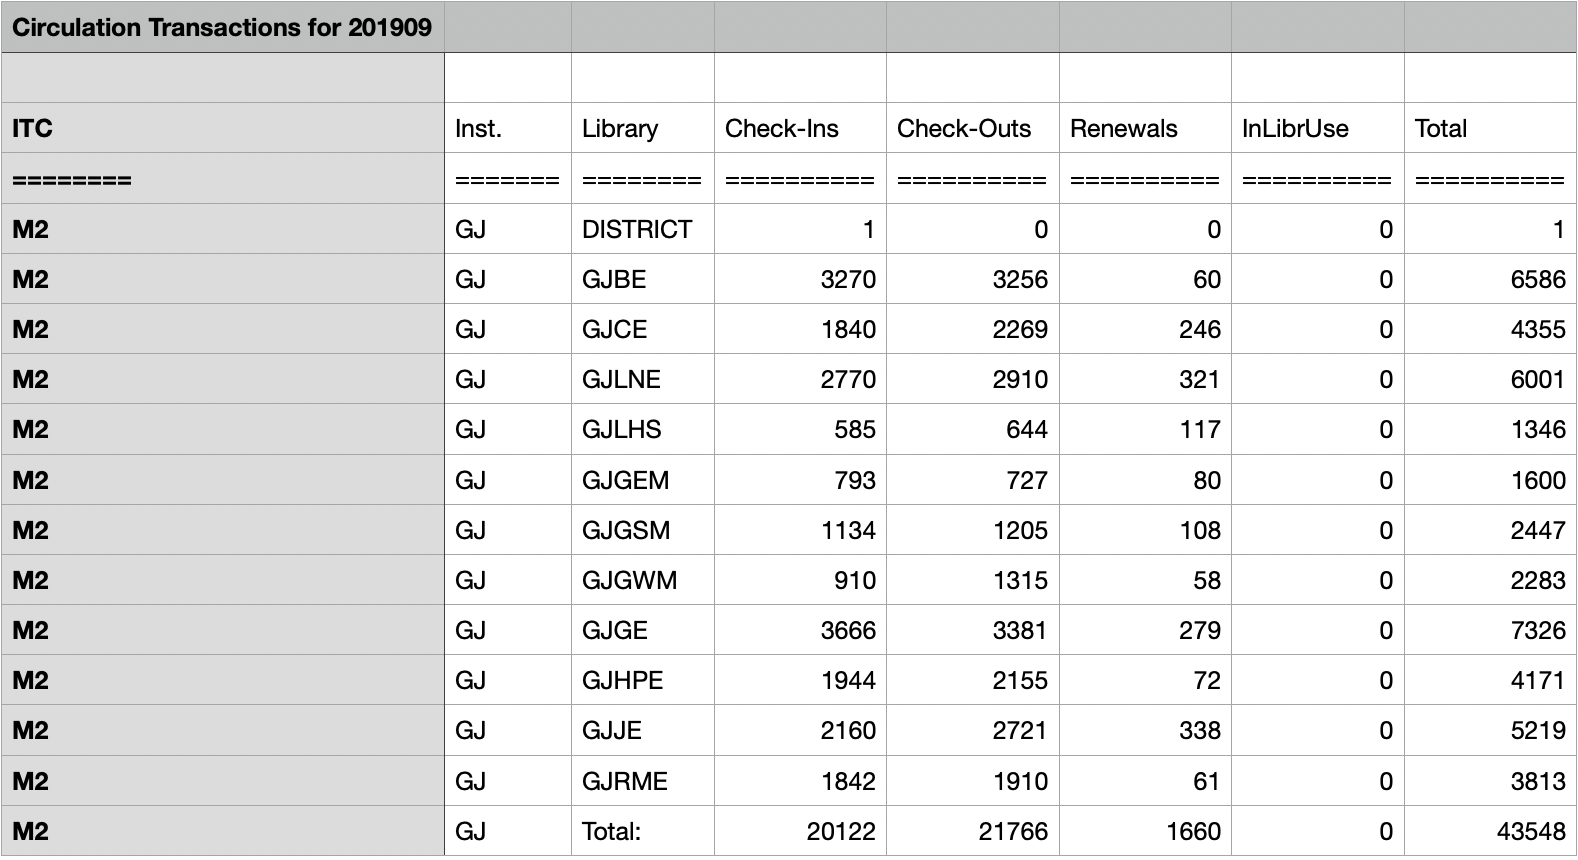
If you are automated through INFOhio's library services platform you should be receiving your library's usage data on the 1st of every month through your school email. These usage reports provide you with the number of check-ins and check-outs. Reporting the number of check-ins and check-outs is a simple number that not only tells the number of books that circulated through your library, but the number of library students and staff that used your library resources. If you are not receiving these reports, contact your INFOhio ITC provider to be added to these emails. Here is an example of a report on Circulation Transactions from September 2019.
In addition, review the reports in the Report Favorites section of the WorkFlows Handbook. In particular, focus on the Promote Library and Statistics sections reports such as:
Digital Resource Use Data
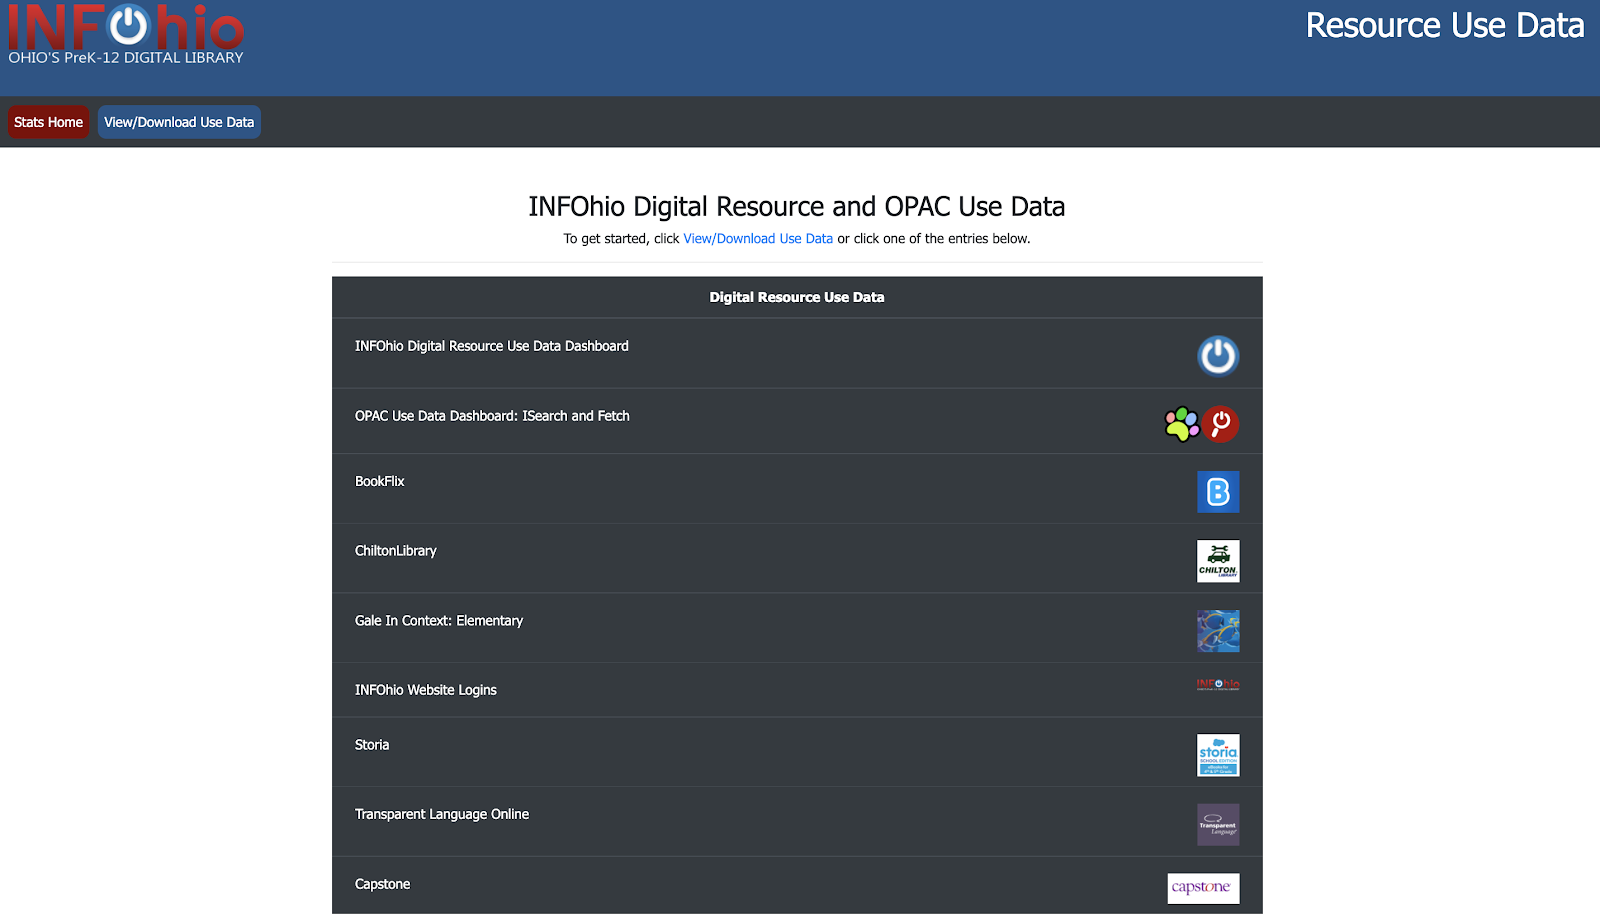
INFOhio is able to share use data for ISearch (if your school is automated with INFOhio) and for many digital resources. Details about which resources are available can be found on the INFOhio Resource Use Data page. This page has been created and updated to make it easier to find each school district or building’s usage of digital resources.
Clicking on any of these digital resources will provide search fields pictured below.
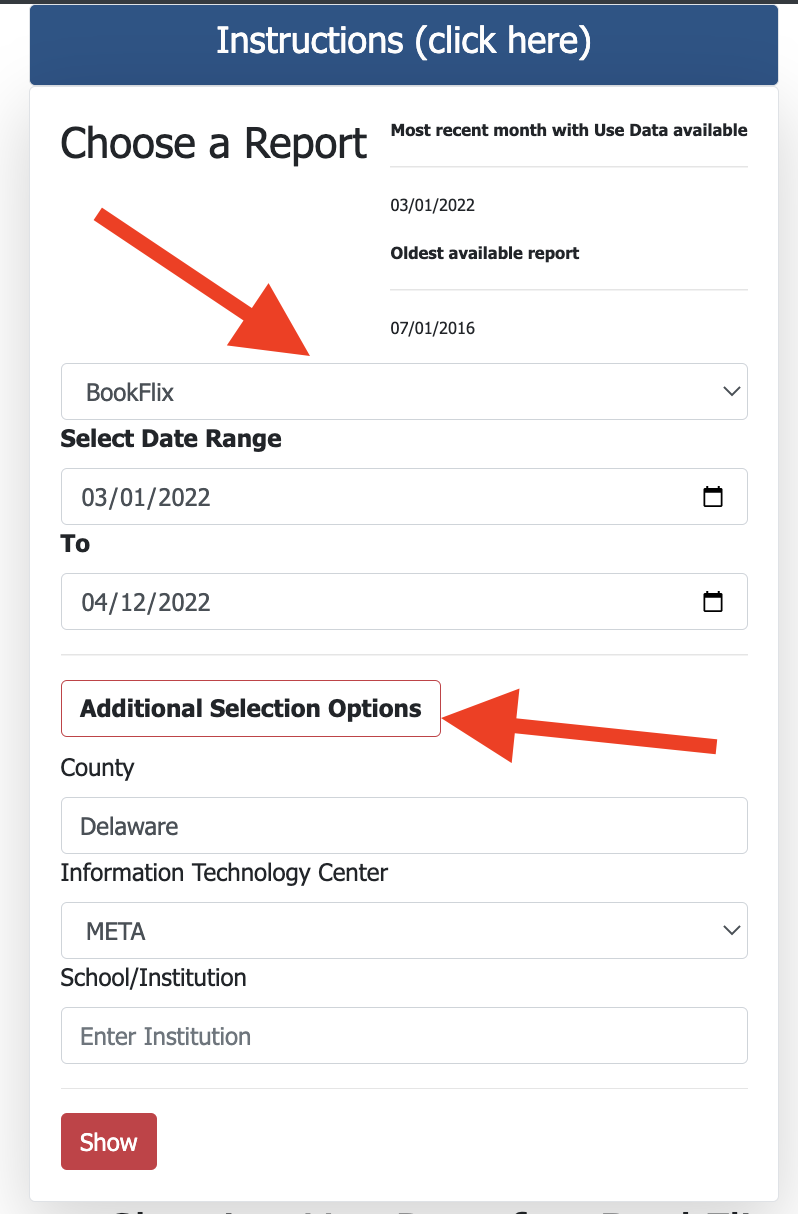
Follow these steps to fill in the search fields appropriately:
-
Choose a digital resource from the drop-down menu.
-
Fill in the date range.
-
Click Additional Selection Options and type your county name and choose your ITC.
-
Click the Show button.
-
Your school's usage data will be listed in the table below the search fields.
Sharing Your Library by the Numbers
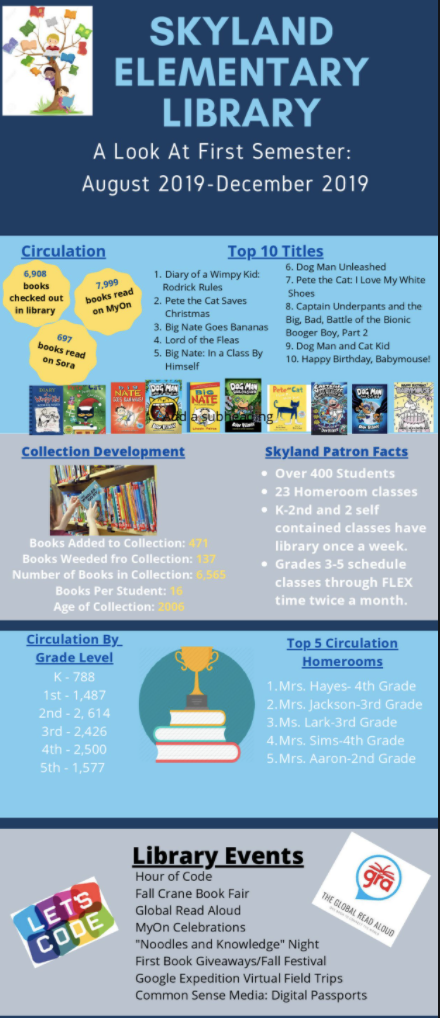
As the AASL Toolkit for Promoting School Library Programs says, “When it comes to getting your message across, how you share information can be as important as what you say” (p. 25). Sharing your usage data can be completed in eye-catching, engaging ways in the form of infographics, visual reports, and promotion on social media.
Once you have the statistics and data collected, spend some time reviewing and understanding your data. Put your data in an infographic to give your audience a clearer picture of your library numbers. Check out some of the free infographic creation tools like Canva, Easel.ly, and Piktochart.
Then share with your administrators, school district, and community how the numbers tell a story about the impact of your library on the community of learners in your school district.
Also, promote awareness by sharing on social media. The OELMA Communications team recently developed a fill-in-the-blank document that can be used to advocate for your library on social media. Similar to Mad Libs, those silly, laugh-out-loud, fill-in-the-blank word games, in this Library Libs version simply, fill in the blanks with your facts and figures and share these pre-created posts to your social media accounts with your administration and staff. Adding a picture or infographic will help draw attention to your post.

To learn more about library advocacy, take INFOhio’s Advocacy: Sharing the Value of Your School Library class in the School Library Basics Learning Pathway. After completing the course and submitting the final quiz, you can earn a certificate for 2 contact hours.
INFOhio, Ohio’s PreK-12 Digital Library, is here to support you. If you have questions or need help with advocacy, please contact us at support.infohio.org.
.jpg)